Underappreciated and Overpriced? Japanese Rice Exports Sluggish
Economy- English
- 日本語
- 简体字
- 繁體字
- Français
- Español
- العربية
- Русский
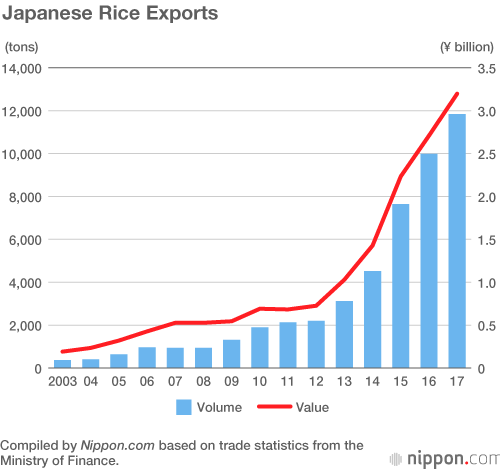
In 2007 Japan exported just 940 tons of polished rice, a figure that increased over 12.5 times in the following decade, to 11,841 tons in 2017. While a tenfold-plus increase over 10 years may seem like great gains, the monetary value of the 2017 exports reached just ¥3.20 billion. (To put this in perspective, that amount is slightly less than the estimated ¥3.25 billion that will go this year to Andrés Iniesta, a Spanish soccer player who transferred from a top Spanish soccer team to Vissel Kobe, a Japanese team in the J. League Division 1). In 2013, washoku—or Japanese cuisine—was added to UNESCO’s Intangible Cultural Heritage list, adding fresh momentum to a global boom in healthy Japanese meals. While many people outside of Japan enjoy sushi and beef bowls, though, rice grown in Japan has not been as widely adopted around the world as expected.

The top export destination of Japanese rice in 2017 was Hong Kong, which imported 4,128 tons worth ¥1.02 billion. These are 12-fold volume and 6-fold value increases compared with 10 years ago. In second place was Singapore, with similarly steep 17-fold volume and 8-fold value increases. Exports to the United States, Britain, and Australia are also gradually increasing. But these countries and regions are high-income markets where high-priced branded rice is already available in retail channels, and there is demand driven by customers who want to eat delicious rice from Japan. It is difficult to say whether these exports will continue to increase rapidly in the future, though.

Cultivation of Japanese rice varieties is expanding in the United States and China, where price levels are about half of what they are in Japan. China, with its great demand, grows the Koshihikari and Akita Komachi varieties of rice locally, distributing them at about one-fifth to one-tenth the price of imported Japanese rice. The high quality of Japanese rice is its selling point, but the reality is that only some people with high incomes are willing to pay the price difference despite its superior taste. Even Japanese restaurants abroad are purchasing American or Chinese rice, with the exception of high-end establishments.
As Japan's domestic demand tapers due to the aging and declining population, development of overseas markets is an important issue for rice farmers in the longer term. However, there is a reason why rice farmers are not aggressively planting rice for export. As part of a policy to reduce the acreage of farms, farmers who convert edible rice to animal feed receive large subsidies. Rice for animal feed has no cosmetic requirements, so it is advantageous in that it does not take too much time to produce—thus bringing farm profits to the same level as they would be for the more labor-intensive job of growing branded rice like Koshihikari. This naturally incentivizes working for a stable, subsidized income rather than risking exposure to competitive pricing in new markets abroad.
The government has set goals to expand exports of Japanese agriculture, forestry and fishery products, and food to ¥1 trillion by 2019 (¥807.1 billion worth was exported in 2017), but rice and rice processed products are unlikely to account for any more than ¥60 billion of that amount. Furthermore, the set target value for polished rice is a modest ¥3 billion, while processed rice products (including rice crackers and sake) make up ¥57 billion of the total amount of exported rice.
Rice is an agricultural product that represents Japan, but the country ranks only tenth in the world in terms of production volume. Major rice exporters India and Thailand export about 10 million tons per year. Although delicious, there seems to be limited room for Japan’s rice—which is too expensive—to achieve dramatic growth in global markets.World Polished Rice Production
| Country | Production volume (million tons) | |
|---|---|---|
| 1 | China | 144.5 |
| 2 | India | 104.8 |
| 3 | Indonesia | 35.8 |
| 4 | Bangladesh | 34.5 |
| 5 | Vietnam | 28.1 |
| 6 | Thailand | 18.8 |
| 7 | Myanmar | 12.6 |
| 8 | Philippines | 11.9 |
| 9 | Brazil | 8.5 |
| 10 | Japan | 7.8 |
| 11 | United States | 7.1 |
| 12 | Pakistan | 6.9 |
Compiled by Nippon.com based on data from the Ministry of Agriculture, Forestry, and Fisheries.
(Translated from Japanese. Banner photo © Pixta.)